# Debugging Your Code
Two modes are support for debugging
- Remote Attaching to the running process in Visual Studio Code.
- Native Code debugging (Visual Studio / Windows only)
To follow this guide use an OpenTAP GUI like PathWave Test Automation or OpenTAP TUI.
# Remote Attaching to the Running Process With VS Code
- Install the debugpy package using 'pip'. This can also be done by installing the PythonExamples package.
- Enable debugging in Python Settings.
- Start you OpenTAP GUI
- From VS Code, open the folder containg your code. For example the OpenTAP installation folder.
- Set a break point in your code
- Click F5 and use 'Python: Remote Attach'
This should generate a launch.json file like so:
{
    // Use IntelliSense to learn about possible attributes.
    // Hover to view descriptions of existing attributes.
    // For more information, visit: https://go.microsoft.com/fwlink/?linkid=830387
    "version": "0.2.0",
    "configurations": [
        {
            "name": "Python: Remote Attach",
            "type": "python",
            "request": "attach",
            "connect": {
                "host": "localhost",
                "port": 5678
            },
            "pathMappings": [
                {
                    "localRoot": "${workspaceFolder}",
                    "remoteRoot": "."
                }
            ],
            "justMyCode": true,
        }
    ]
}
The 'Attach using Process Id' debugging option is also available on some platforms, but may not be as reliable.
In case an error occurs due to port 5678 being used by another process, the debugging port can be configured in the Python settings panel.
# Native Code Debugging
Launch your OpenTAP GUI.
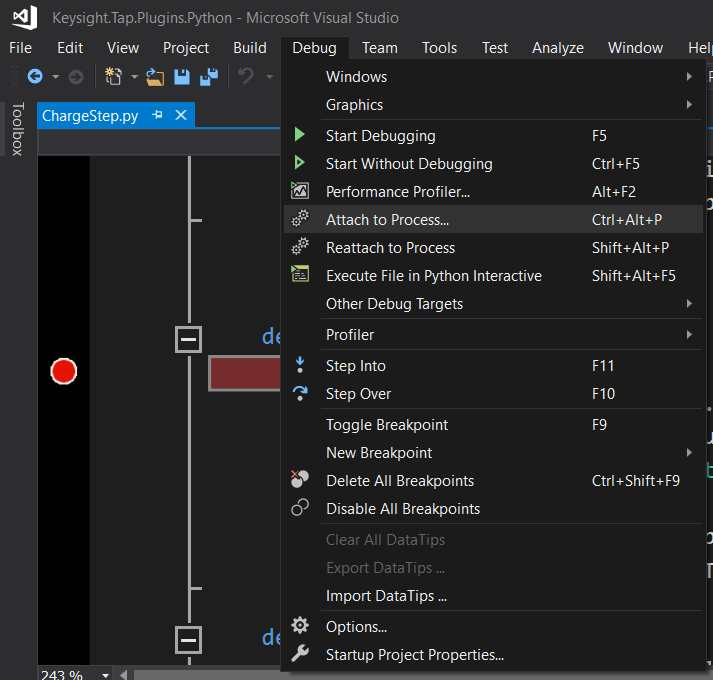
Start up Microsoft Visual Studio, and select Debug, Attach to Process.
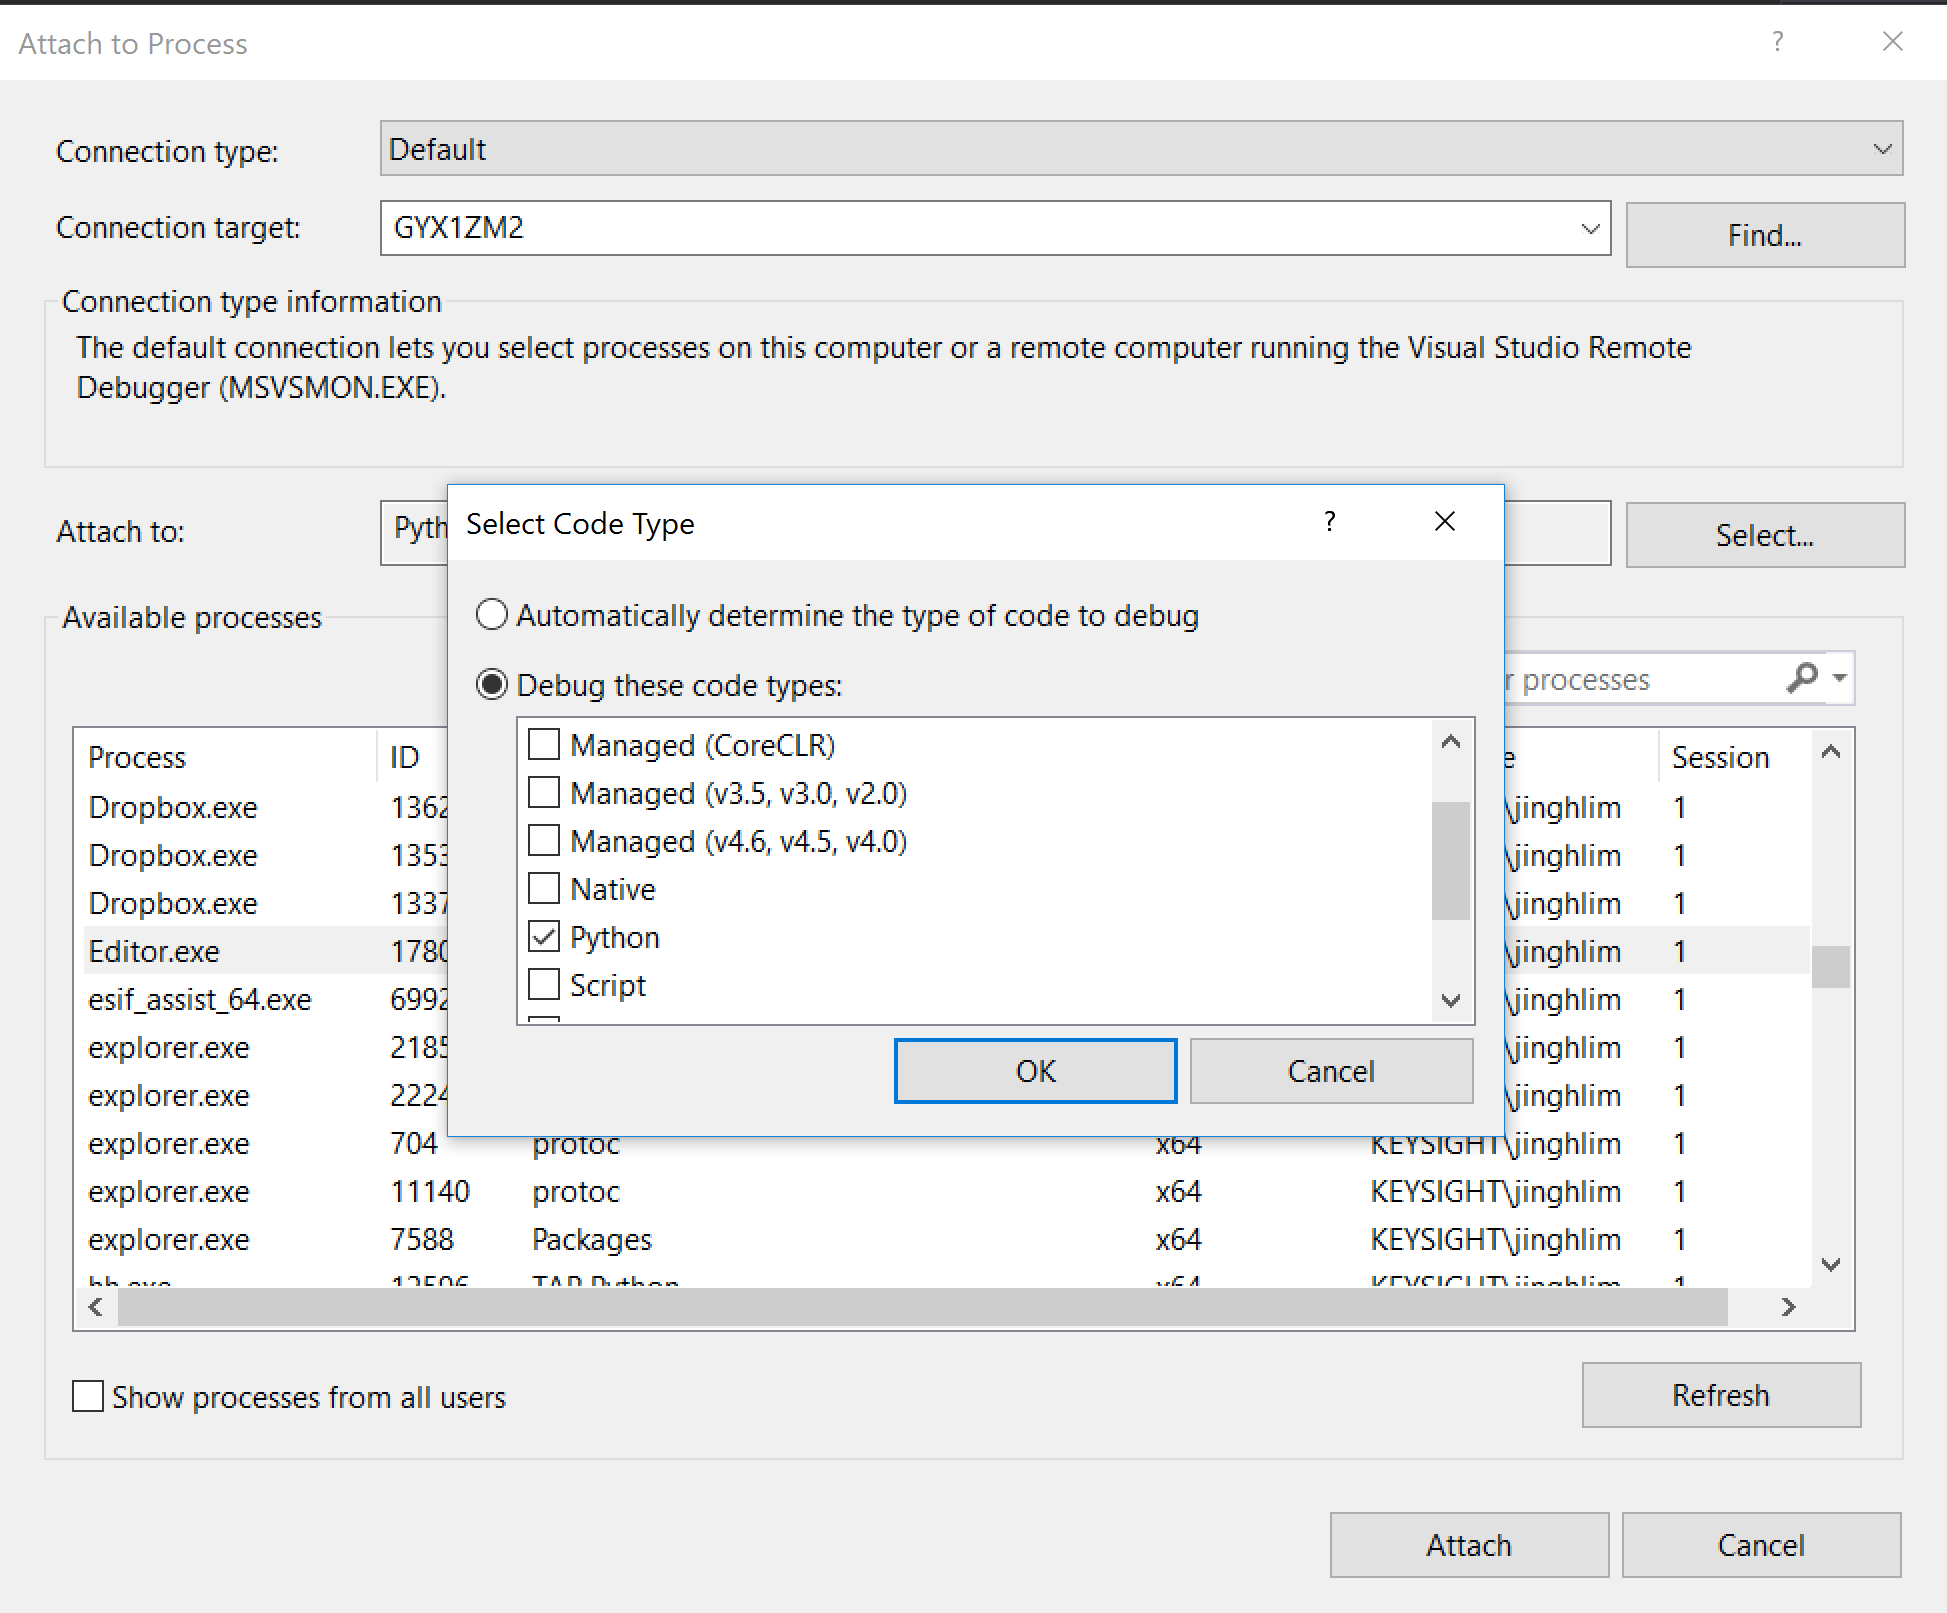
- Click on Select, then select
Debug these code types:, select Python and click OK.
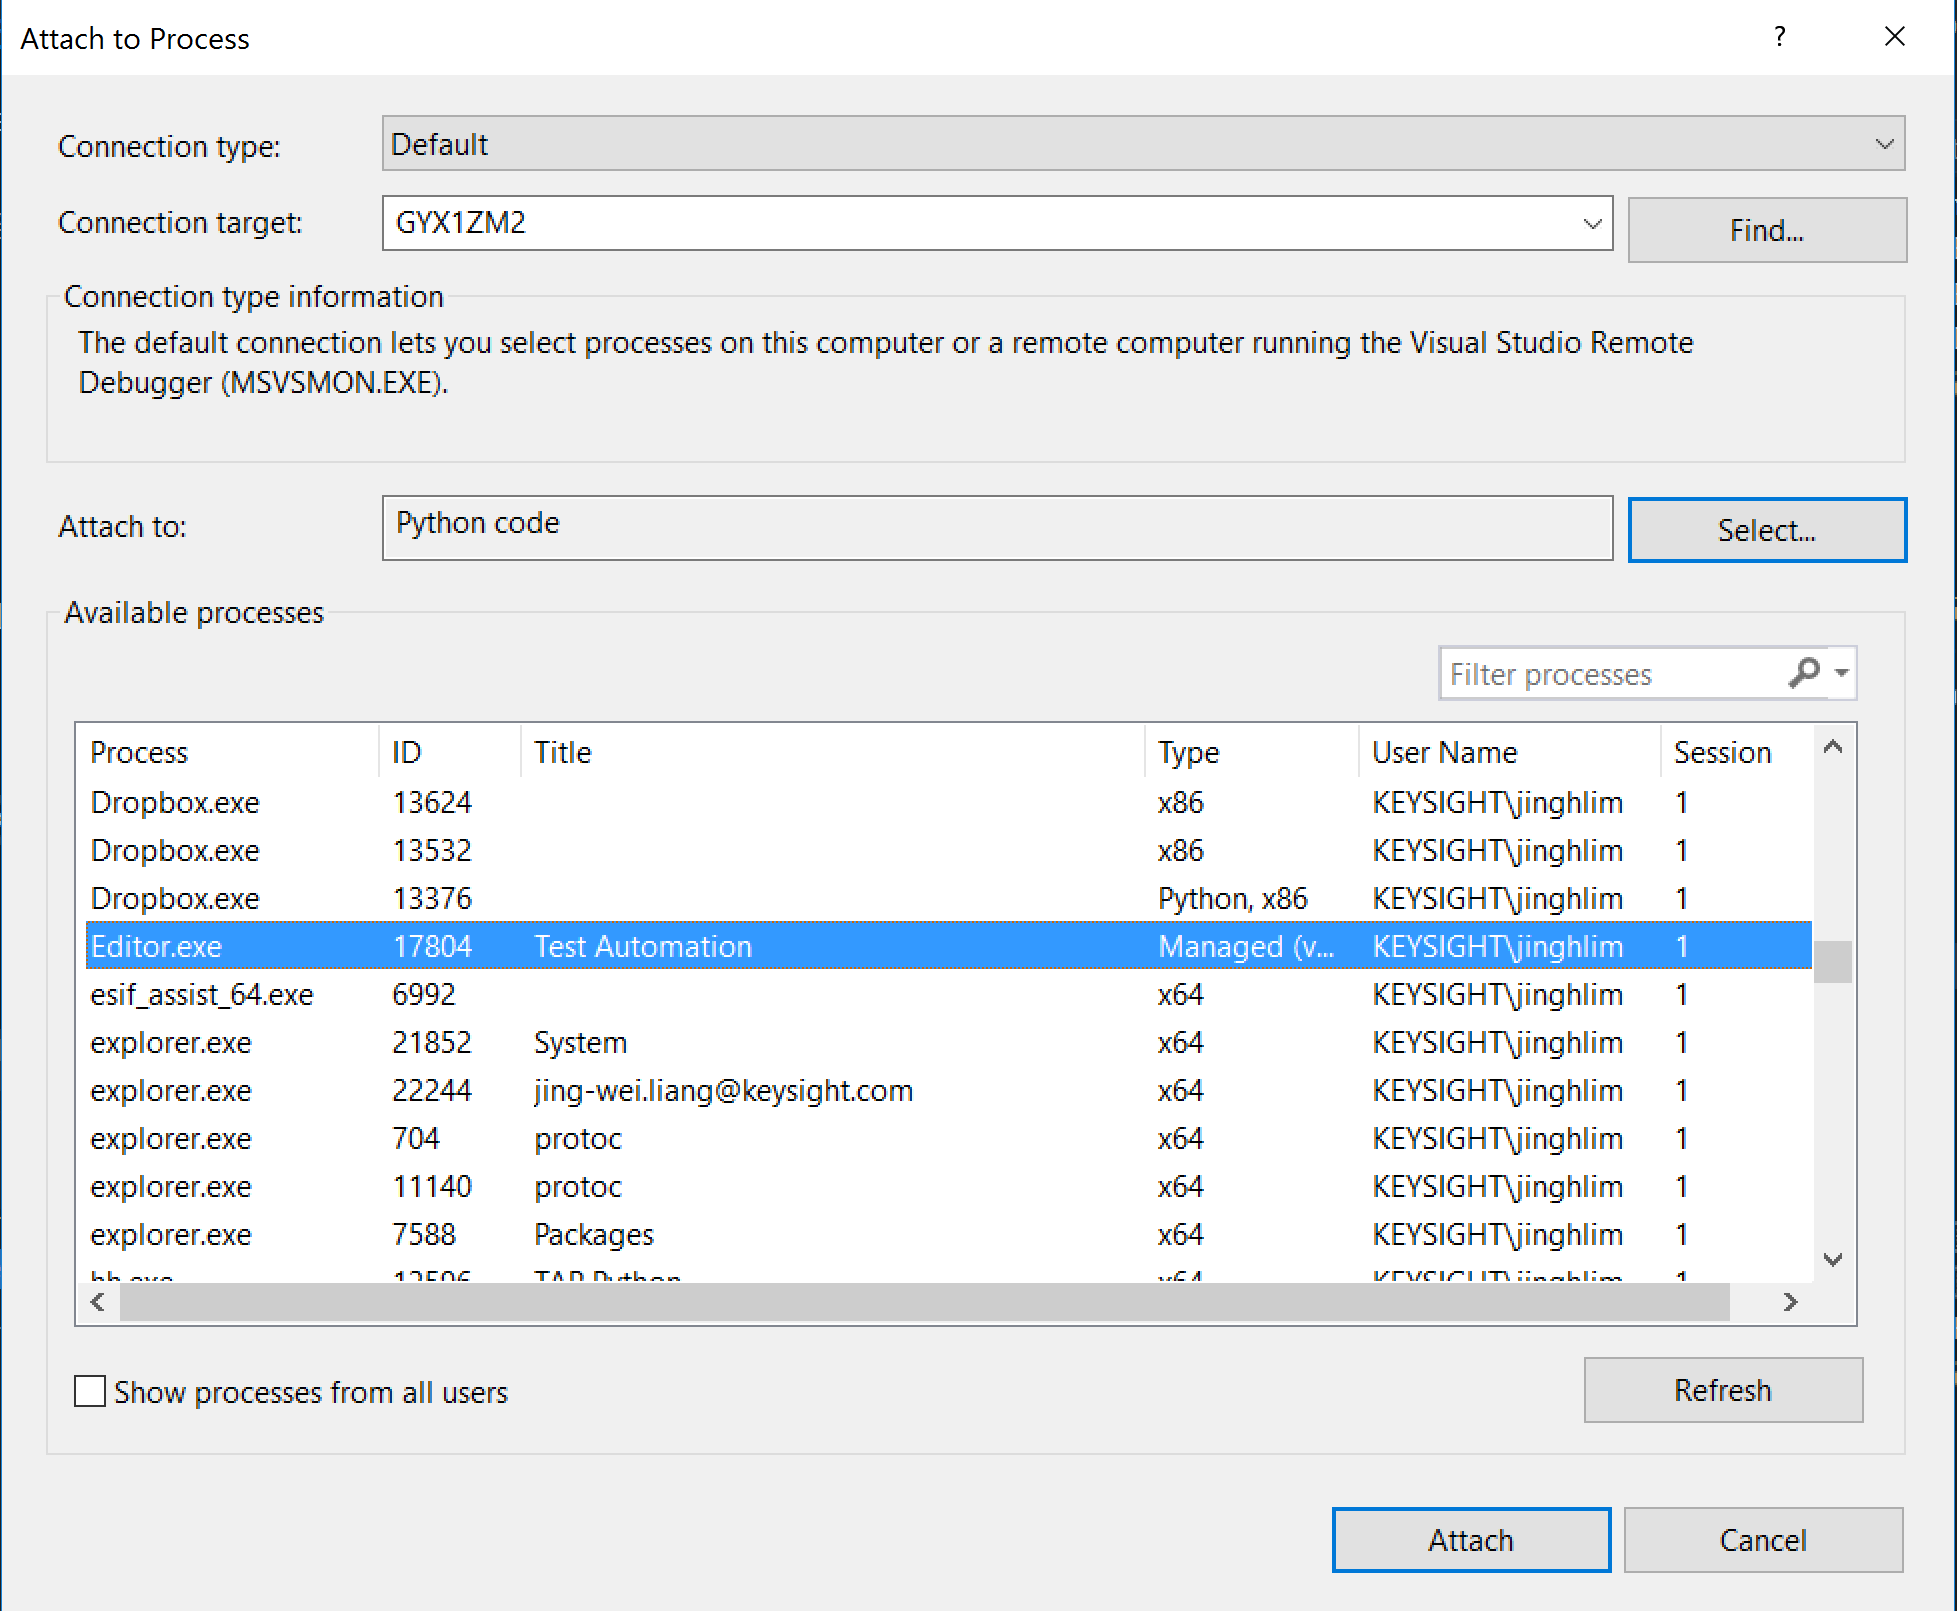
- Select Editor.exe from the available process list and click attach.
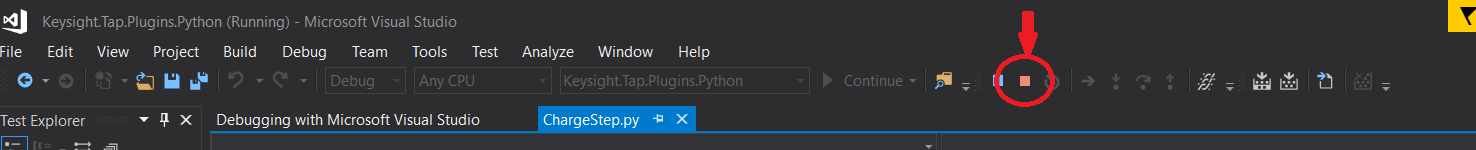
- If there is no error message shown, and the stop button is enabled, you can now feel free to debug the Python script.
# Debugging And Threads
When you debug multi-threaded Python applications, you might need to register each new thread you create. This is not the case for 'native debugging', but when using debugpy, the thread needs to be registered.
To ensure debugging works in a given thread, call opentap.debug_this_thread().
This is already being done from the opentap.TestStep baseclass, but in other contexts you might to call it explicitly.
The only way you notice the problem is that breakpoints does not get registered in the given thread.
Additionally, debugging can lead to instabilities on Linux and MacOS, most often noticed by a segmentation fault towards the end of a process.